


Learn Statistics with ChatGPT: A Prompt Engineering Approach to Master Descriptive and Inferential Statistics
Master the Art of Learning Statistics Step-by-Step Using AI-Powered Prompts — From Basics to Advanced Concepts in Descriptive and Inferential Statistics.

In today’s AI-driven learning environment, mastering Statistics no longer requires stacks of textbooks and hours of isolated study. Thanks to Large Language Models (LLMs) like ChatGPT, anyone can build a strong foundation in Statistics using a smart technique: Prompt Engineering.
🧠 If you're new to Prompt Engineering or want to master it further, check out my detailed article:
"The Ultimate Guide to Prompt Engineering – Mastering AI Conversations: Your Guide to Prompt Engineering, Tools, and Real-World Impact"
Read it here
This article offers a complete guide on how to learn both Descriptive and Inferential Statistics using tailored prompts. Whether you're a student, data analyst, AI enthusiast, or working professional, this method is for you.
What is Prompt Engineering?
Prompt engineering is the art of crafting specific and structured inputs (prompts) to get meaningful, accurate, and educational responses from AI models like ChatGPT.
How to Learn Statistics with ChatGPT: The Generic Prompt Framework
You can use this prompt format for any Statistics topic:
Generic Prompt Template:
"Explain the topic [Insert Topic Name] in Statistics to a beginner.
Include the following elements:
Simple definition with clear explanation
Real-life analogy for easy understanding
Use case in a real-world scenario
Formula(s), if applicable, and explanation of each term
Step-by-step worked-out numerical example
One practice question for me to try on my own
End with a short quiz (2–3 questions) to test my understanding."
Core Topics in Statistics You Can Learn with This Method
Applications of Statistics

Descriptive Statistics:
Types of Data: Qualitative vs Quantitative
Scales of Measurement: Nominal, Ordinal, Interval, Ratio
Frequency Distribution
Measures of Central Tendency: Mean, Median, Mode
Measures of Dispersion: Range, Variance, Standard Deviation
Skewness and Kurtosis
Correlation and Covariance
Data Visualization: Histograms, Boxplots, Bar Graphs, Pie Charts
Inferential Statistics:
Population vs Sample
Sampling Techniques (Random, Stratified, Cluster)
Central Limit Theorem
Confidence Intervals
Hypothesis Testing (Z-test, t-test, Chi-square test, ANOVA)
p-value and Statistical Significance
Type I and Type II Errors
Regression Analysis (Simple and Multiple Linear Regression)
Non-parametric Tests
Bayesian Inference
Example: Using the Prompt Template for “Standard Deviation”
Here’s how you can apply the generic template to learn about Standard Deviation:
Final Prompt:
"Explain the topic Standard Deviation in Statistics to a beginner.
Include the following elements:
Simple definition with clear explanation
Real-life analogy for easy understanding
Use case in a real-world scenario
Formula(s), if applicable, and explanation of each term
Step-by-step worked-out numerical example
One practice question for me to try on my own
End with a short quiz (2–3 questions) to test my understanding."
What You Will Get from ChatGPT:
1. Simple Definition with Clear Explanation
Standard Deviation is a measure of how spread out the numbers in a dataset are.
If the standard deviation is low, it means the numbers are close to the average (mean).
If it’s high, the numbers are more spread out from the mean.
It tells you how much variation or “deviation” there is from the average.
2. Real-Life Analogy: "Bus Arrival Times"
Imagine a bus is supposed to arrive at 8:00 AM every day.
If it usually arrives at 8:01, 7:59, or 8:02, then its arrival time is consistent — low standard deviation.
If it arrives at 7:30 one day, 8:45 the next, 7:50 another, the arrival time is inconsistent — high standard deviation.
So, Standard Deviation = How punctual (or unpredictable) the bus is.
3. Use Case in a Real-World Scenario
In education, if a teacher gives a test to two classes:
Both classes have the same average score (e.g., 70).
But:
Class A's scores are: 68, 69, 70, 71, 72 → Low Standard Deviation (consistent performance).
Class B's scores are: 50, 60, 70, 80, 90 → High Standard Deviation (some did poorly, some did great).
So, standard deviation helps identify performance consistency.
4. Formula and Explanation

5. Step-by-Step Worked-Out Example
Let's take the sample data:
[5, 7, 3, 7, 10]
Step 1: Find the Mean

Step 2: Subtract the Mean and Square the Differences
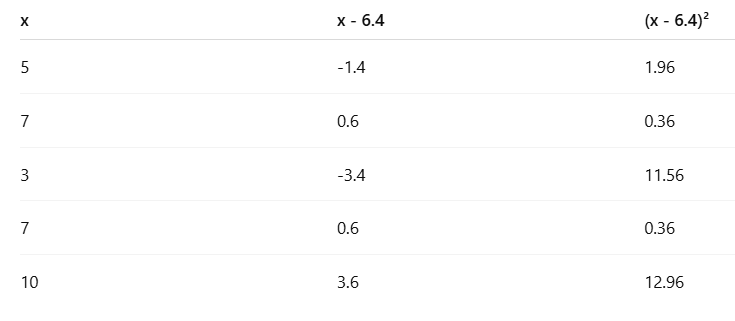
Step 3: Sum the Squared Differences
1.96 + 0.36 + 11.56 + 0.36 + 12.96 = 27.2
Step 4: Divide by n - 1 (sample → 5 - 1 = 4)
27.2 / 4 =6.8
Step 5: Take the Square Root
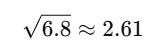
Standard Deviation = 2.61
6. Practice Question
Try calculating the sample standard deviation for the following dataset:
[4, 6, 8, 6, 6]
(You can follow the same 5 steps above. I’ll check your answer if you share it!)
7. Mini Quiz (2–3 Questions)
Q1: What does a low standard deviation indicate about the data?
A) Data is widely spread out
B) Data is close to the mean
C) Data is skewed
D) Data has more values
Q2: Which one likely has a higher standard deviation?
A) [45, 46, 47, 48, 49]
B) [10, 90, 15, 80, 20]
Q3: In the formula, why do we square the differences from the mean?
A) To remove negative signs
B) To get a larger value
C) To make mean 0
D) Because standard deviation is always squared
Why This Approach Works
✅ It encourages active learning
✅ Combines conceptual, visual, and applied understanding
✅ Promotes self-paced problem solving
✅ Enables you to revisit and refine learning iteratively
Tip: Customize Your Prompt
Add these variations to deepen understanding:
For Real-World Relevance
"Add a real dataset for me to analyze""Give an example from the finance/healthcare/education industry""Show how this is used in a data science project"
For Concept Comparison
"Compare this topic with [another topic]""How is this different from variance/mean/median?""What is the difference between population and sample standard deviation?"
For Pitfall Awareness
"Give me common mistakes to avoid""What misconceptions do students often have about this?""Explain tricky interview questions related to this concept"
For Python & Code Examples
"Suggest Python code for this concept""Write a function in Python to calculate this""Use NumPy and Pandas to demonstrate this""Visualize the standard deviation using Matplotlib"
For Understanding & Practice
"Ask me 3 questions to test my understanding""Give me a step-by-step worksheet to try""Create a quiz with answers and explanations""Explain this concept like I’m 10 years old"
For Digging Deeper
"Explain the derivation of the formula""How is this used in machine learning models?""What’s the historical background of this formula?""Where does standard deviation fall short?"
Final Thoughts
ChatGPT is your always-available tutor. With well-structured prompts, you can explore every fundamental topic in Statistics at your own pace. Make learning interactive, intuitive, and intelligent with the power of prompt engineering.
Now go ahead – pick a topic, craft your prompt, and start mastering Statistics the AI way!
If you liked this guide, don’t miss my upcoming breakdown of each statistical concept using ChatGPT prompts. Subscribe to get them straight in your inbox!
For more in-depth technical insights and articles, feel free to explore:
Girish Central
LinkTree: GirishHub – A single hub for all my content, resources, and online presence.
LinkedIn: Girish LinkedIn – Connect with me for professional insights, updates, and networking.
Ebasiq
Substack: ebasiq by Girish – In-depth articles on AI, Python, and technology trends.
Technical Blog: Ebasiq Blog – Dive into technical guides and coding tutorials.
GitHub Code Repository: Girish GitHub Repos – Access practical Python, AI/ML, Full Stack and coding examples.
YouTube Channel: Ebasiq YouTube Channel – Watch tutorials and tech videos to enhance your skills.
Instagram: Ebasiq Instagram – Follow for quick tips, updates, and engaging tech content.
GirishBlogBox
Substack: Girish BlogBlox – Thought-provoking articles and personal reflections.
Personal Blog: Girish - BlogBox – A mix of personal stories, experiences, and insights.
Ganitham Guru
Substack: Ganitham Guru – Explore the beauty of Vedic mathematics, Ancient Mathematics, Modern Mathematics and beyond.
Mathematics Blog: Ganitham Guru – Simplified mathematics concepts and tips for learners.