
Introduction to NumPy: Simplifying Numerical Operations in Python

NumPy (Numerical Python) is a popular Python library used for numerical computations. It provides support for large, multi-dimensional arrays and matrices, along with a collection of mathematical functions to operate on them.
Main Features of NumPy:
N-Dimensional Array (ndarray):
Core feature: an efficient multi-dimensional array that allows for fast operations.
Mathematical and Logical Operations:
Perform element-wise operations and aggregate functions like sum, mean, max, etc.
Broadcasting:
Perform operations on arrays of different shapes, avoiding explicit loops.
Linear Algebra Functions:
Includes functions like dot product, matrix multiplication, eigenvalues, and more.
Integration with Other Libraries:
Works seamlessly with libraries like Pandas, Matplotlib, and SciPy.
Memory Efficiency:
Consumes less memory and performs computations faster compared to standard Python lists.
Random Number Generation:
Supports generating random numbers for simulations and modeling.
Why is NumPy Used?
Scientific Computing: It simplifies handling data in numerical computing.
Data Preprocessing: Often used to prepare data for machine learning models.
Performance: NumPy operations are faster than pure Python loops.
Mathematical Operations: Ideal for implementing algorithms like FFTs, linear algebra, and statistics.
Real-Time Examples of NumPy Usage
Data Analysis and Machine Learning:
Used for preprocessing datasets, such as scaling and normalization.
Simulations:
Monte Carlo simulations to model probabilistic scenarios.
Image Processing:
Used to manipulate images as arrays of pixel values.
Signal Processing:
Performing FFT (Fast Fourier Transform) for time-series analysis.
Basic Concepts of NumPy with Python Code Examples
Creating Arrays
Arrays are the core data structure in NumPy. You can create arrays from Python lists.
A 1D array is like a simple list.
A 2D array (matrix) can be visualized as rows and columns.
 1D array
arr_1d = np.array([1, 2, 3, 4])
print("1D Array:", arr_1d)

# 2D array
arr_2d = np.array([[1, 2], [3, 4]])
print("2D Array:\n", arr_2d)
Array Operations
You can perform element-wise operations on NumPy arrays without writing loops.
# Element-wise operations
arr = np.array([10, 20, 30])
print("Add 5:", arr + 5)
print("Multiply by 2:", arr * 2)
The operations (+, *) apply to each element in the array, avoiding explicit loops and making code faster.
Broadcasting
Broadcasting allows NumPy to work with arrays of different shapes when performing operations.
arr = np.array([1, 2, 3])
print("Broadcasting with scalar:", arr + 10)

arr2 = np.array([[1], [2], [3]])
print("Broadcasting:\n", arr + arr2)
When adding a scalar (
10), it is broadcast to all elements in the array.The second example shows broadcasting between two differently shaped arrays, avoiding complex reshaping.
Matrix Operations
NumPy supports common linear algebra operations such as dot product and matrix multiplication.
# Dot product of two vectors
a = np.array([1, 2])
b = np.array([3, 4])
dot_product = np.dot(a, b)
print("Dot Product:", dot_product)

# Matrix multiplication
matrix1 = np.array([[1, 2], [3, 4]])
matrix2 = np.array([[5, 6], [7, 8]])
product = np.matmul(matrix1, matrix2)
print("Matrix Multiplication:\n", product)
Dot Product: Calculates the sum of the product of corresponding elements in two arrays.
Matrix Multiplication: Multiplies two 2D matrices, resulting in a new matrix.
Statistical Operations
You can perform aggregate operations such as calculating the mean, standard deviation, and sum.
data = np.array([10, 20, 30, 40, 50])
print("Mean:", np.mean(data))
print("Standard Deviation:", np.std(data))
print("Sum:", np.sum(data))
Mean: Average of the elements.
Standard Deviation: Measure of the amount of variation in the data.
Sum: Total of all the elements in the array.
Generating Random Numbers
NumPy’s random module helps generate random data for simulations or testing.
# Random numbers between 0 and 1
random_array = np.random.rand(5)
print("Random Numbers:", random_array)

# Random integers between 10 and 50
random_integers = np.random.randint(10, 50, size=(3, 3))
print("Random Integers:\n", random_integers)
rand()generates floating-point numbers between 0 and 1.randint()generates random integers within the given range.
Reshaping Arrays
The reshape() function changes the shape of an existing array without modifying its data.
arr = np.array([1, 2, 3, 4, 5, 6])
reshaped = arr.reshape((2, 3))
print("Reshaped Array:\n", reshaped)
The array
[1, 2, 3, 4, 5, 6]is reshaped into a 2x3 matrix.Reshaping is useful when you want to convert a 1D array into a multi-dimensional array for computations.
Slicing and Indexing
You can access elements or subsets of an array using slicing and indexing.
arr = np.array([10, 20, 30, 40, 50])
print("First element:", arr[0])
print("Elements from index 1 to 3:", arr[1:4])
Access elements using indexes (like
arr[0]for the first element).Slicing (e.g.,
arr[1:4]) allows extracting a sub-array from index 1 to 3 (excluding index 4).
Handling Missing Data (Using NaN)
NumPy uses NaN (Not a Number) to represent missing or invalid data.
data_with_nan = np.array([10, np.nan, 30, np.nan, 50])
print("Mean ignoring NaN:", np.nanmean(data_with_nan))
nanmean()computes the mean while ignoring NaN values.This is particularly useful in data analysis when dealing with incomplete datasets.
Integration of NumPy with Pandas and Matplotlib
Scenario:
You have sales data for 12 months stored as a NumPy array. You want to:
Convert this array into a Pandas DataFrame for easier data manipulation.
Plot the data using Matplotlib to visualize the trend.
import numpy as np
import pandas as pd
import matplotlib.pyplot as plt
# Step 1: Create a NumPy array with monthly sales data
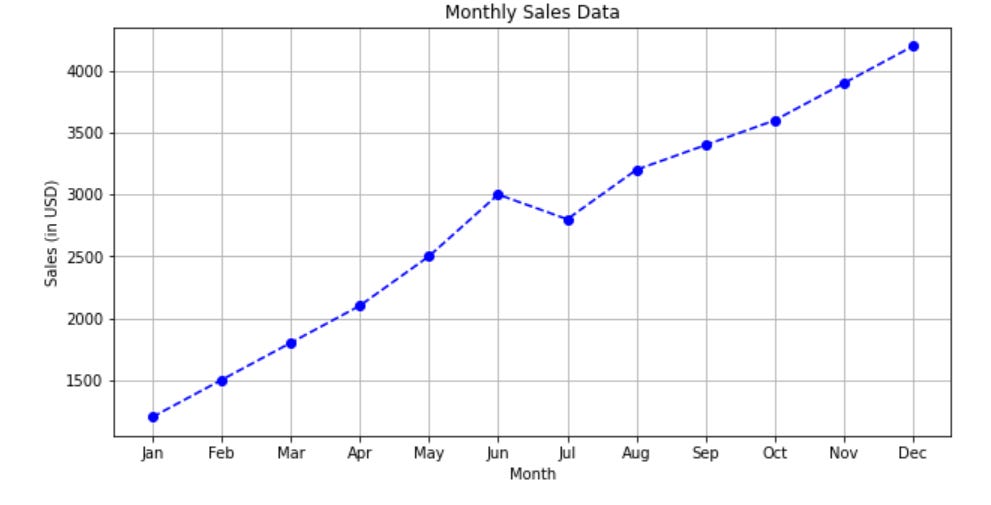
monthly_sales = np.array([1200, 1500, 1800, 2100, 2500, 3000,
2800, 3200, 3400, 3600, 3900, 4200])
# Step 2: Convert NumPy array into a Pandas DataFrame
df = pd.DataFrame(monthly_sales, columns=['Sales'],
index=['Jan', 'Feb', 'Mar', 'Apr', 'May', 'Jun',
'Jul', 'Aug', 'Sep', 'Oct', 'Nov', 'Dec'])
print("Pandas DataFrame:")
print(df)
# Step 3: Plot the data using Matplotlib
plt.figure(figsize=(10, 5)) # Set the figure size
plt.plot(df.index, df['Sales'], marker='o', linestyle='--', color='b')
# Step 4: Add labels and title
plt.title('Monthly Sales Data')
plt.xlabel('Month')
plt.ylabel('Sales (in USD)')
plt.grid(True) # Add a grid for better readability
# Display the plot
plt.show()
Output
Pandas DataFrame:
Pandas DataFrame:
     Sales
Jan   1200
Feb   1500
Mar   1800
Apr   2100
May   2500
Jun   3000
Jul   2800
Aug   3200
Sep   3400
Oct   3600
Nov   3900
Dec   4200
Matplotlib Plot:
The graph will show a line plot of the monthly sales trend, helping to visualize how sales have increased throughout the year.
Explanation
Creating the NumPy Array:
We store sales data for 12 months in a 1D NumPy array.
Using Pandas:
The NumPy array is converted to a Pandas DataFrame to add column names and index values (months).
DataFrames provide better structure and flexibility for data manipulation and analysis.
Using Matplotlib:
We use Matplotlib to plot the sales trend.
We customize the plot by adding markers, labels, title, and grid for better presentation.
NumPy offers a wide range of capabilities, from basic array manipulations to advanced mathematical operations, all of which are critical for tasks in data science, machine learning, and scientific computing.
For more in-depth technical insights and articles, feel free to explore:
Technical Blog: Ebasiq Blog
GitHub Code Repository: Python Tutorials
YouTube Channel: Ebasiq YouTube Channel
Instagram: Ebasiq Instagram